Chrono-map 4700 whole view
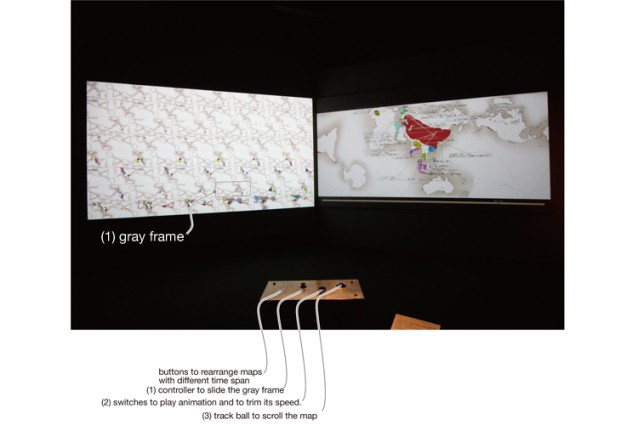
Two projectors and a console compose this interactive installation, Chrono-Map 4700.
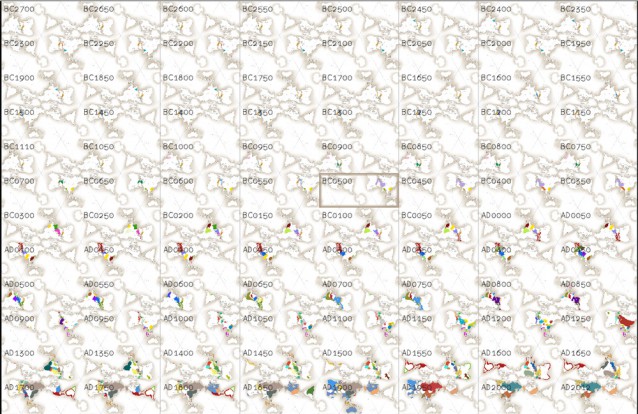
On a screen (A) on the left, you can overview 4700 years of the world history from ancient Egypt to 2012. 96 AuthaGraph maps are tiled and arranged without visible geographical seam. Each map represent the world during respective 50 years. The oldest map shows a world in a period from B.C.2750 to B.C.2700 on left-top corner of the screen (A). The next map covers B.C. 2700 to 2650. These 96 maps are made to cover whole sequence of how our world has been changed.
The history-map was made by referring to a text book for high school in order to visualize how world history commonly known does not evenly cover whole range of the history in terms of both age and region.
Photo by Shintaro Yamanaka, Tokyo Metropolitan Museum of Photography
Chrono-map 4700 whole view
With the controller (1) you can slide a gray frame and choose an age to animate the detailed world map.
And you can press a button (2) to start animation on screen B.
The animation visualizes on an AuthaGraph format where and when dynasties and empires appears and disappears. And it visualizes where and when historical persons were born and died and what he or she has done. You can trim the animation’s speed so as to check the historical facts carefully.
You can roll the track ball to change the center of the map. (3)
Chrono-map 4700 controller
Photo by Shintaro Yamanaka, Tokyo Metropolitan Museum of Photography
Chrono-map 4700
With the bird’s-eye view of past 4700 years, you can see the Mongolian Empire was vast but short-lived therefore appears only once in the chrono-map. Meanwhile the Roman Empire was smaller, but had existed much longer and appears repeatedly in the chrono -map. If you sum up all these Roman Empires, its total size become larger than the size of the Mongolian Empire. Like this way, the temporal perspective provide a different vision of our world.
Chrono-map 4700 scale of time span
Chrono-map 4700 scale of time span
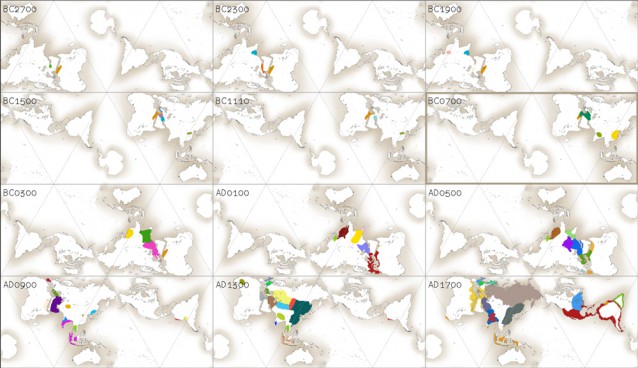
You can choose vision with different scale of time span. This vision describes 4700 year’s history by 12 maps. Each map cell animates 400 years transition.
Chrono-map 4700
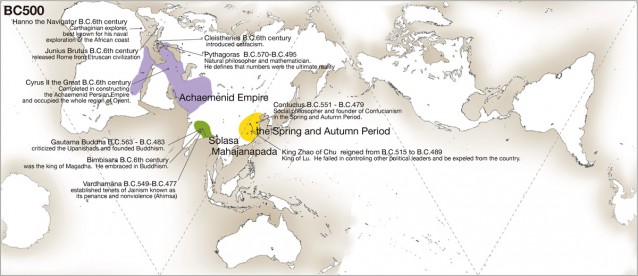
The screen (B) on right shows animated world map. The map shows where and when each country appears and disappears. It shows when and where historical figures were born and died as well as what he or she had done.
This seen is from animation of Chrono-Map, world map in 550 BC to 500 BC. You can see Pythagoras, Buddha and Confucius lived in the same age. It clarifies all historical events in different regions equally in chronological order.
Based information is supplied by Kuboki Shingo, TN Contents studio. Historical contents were supervised by Seki Sinko. System engineering by Ishibashi Motoi, Rhizomatiks.
AuthaGraph Puzzle
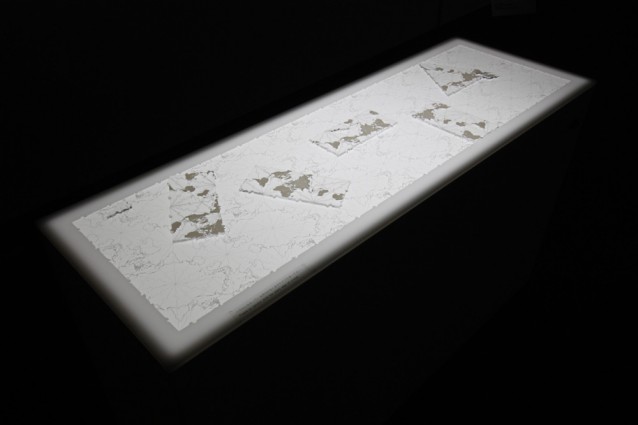
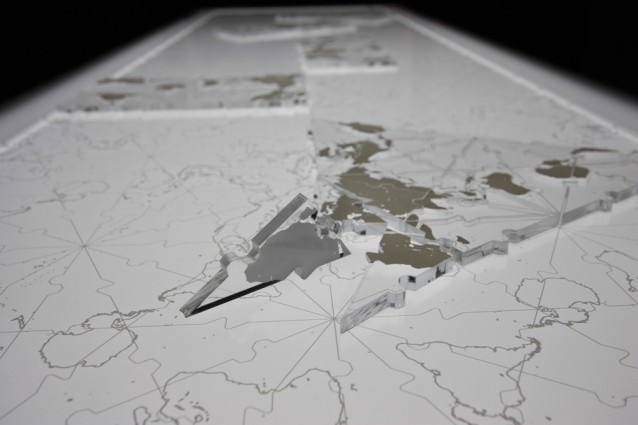
The Puzzle enables visitors to play with and understand geometry of characters of the AuthaGraph map. 24 pieces composes an AuthaGraph Map. There are numbers of world map arrangements. You can make 12 types rectangular maps, 24 types of rhombic (shape like diamond) maps and 4 types of triangular maps. In such way you can customize preferable regions at its center.
AuthaGraph Puzzle
Production: Masuki Co.,LTD.
puzzle pieces and base: silk screen prints (white) on plexy glass
Photo by Shintaro Yamanaka, Tokyo Metropolitan Museum of Photography
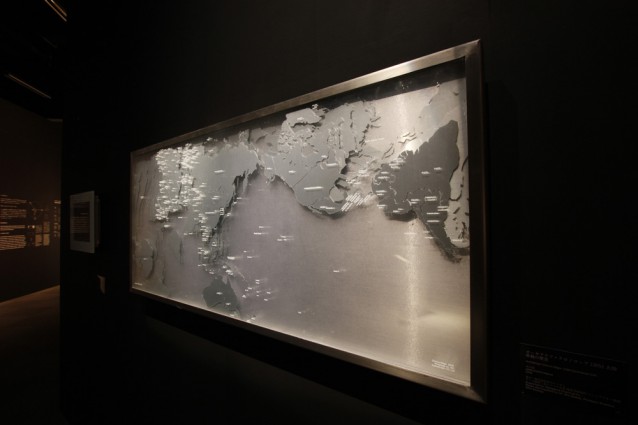
Chrono-Map M120
AuthaGraph Chrono-Map M120 is composed by 5 overlaying maps in different ages from 120 million years ago up to present. Their contour lines represents a coastlines in each age. And it represents the plate techtoniscs’ movements. It clearly shows the Indian continent had moved across the Indian ocean separated from Madagascar and finally collided with Eurasia. It is known that the Himalayas were generated by its impact.
This work is based on a set of data provided by Ron, Blackey, NAU Geology according to the Continental Drift theory by Alfred Lothar Wegener in 1929.


